01dB WebMonitoring
A simple and efficient solution for environmental noise and vibration monitoring.

01dB WebMonitoring is a simple and efficient solution for environmental noise and vibration monitoring.
Its features include the supply of monitoring stations with pre-set parameters, cloud data storage, display of measurement data via a customisable website, real-time alarms, and periodic system checks. 01dB now offers a simple and efficient solution for noise and vibration monitoring activities, thus improving your productivity:
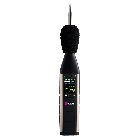
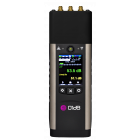
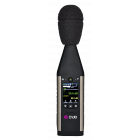
- Pre-set class 1 metrological equipment
- 3G SIM card and subscription provided
- Simplified on-site implementation
- Accessories provided (extension leads, mounting system, etc.)
- Data secured on hosted server, accessible by FTP
- Public or private website that can be customized with your graphic style guide
- Real-time display of data collected by the measurement stations (noise, vibrations, weather information)
- Real-time and offline spectrograms
- System management and on-site operation services (installation, disassembly, maintenance, etc.)
For a fixed monthly fee and a three-month minimum rental period, 01dB WebMonitoring helps you keep costs under control.
New Web Interface
 Now available in a new 3.0 version, the 01dB WebMonitoring interface has been reviewed in order to enhance the user experience and productivity:
- New graphical style for improved legibility
- Dynamic tabs to display or hide information
- New 01dB HeatMap graphics
- New banner with weather information
- Direct integration of the alarm management
- Annual summary page reviewing key indicators
- Summary reports, etc.
This web interface collects the key noise, vibration and weather indicators, and presents the relevant information in clear and simple tables or graphs. Access to the web interface is secured via a user ID and password. It can be made public upon request from a customer. Alternatively, two dedicated web interfaces may be associated with a single project offer: a public one and a private one. In this case, the information contained on each site will be different (please contact us for more information).
In the Cloud
 Noise and vibration monitoring also relates to risk management (e.g. damage to buildings), requiring a reaction almost in real time. As a consequence, 01dB WebMonitoring includes a sophisticated application-oriented alarm management system: triggers based on all available indicators (noise, vibration, weather conditions, etc.), two levels of alarm (orange and red), an alarm count, combination of alarm between two measurement points, and sending alarms information by e-mail.
 HeatMap, a 01dB exclusivity, provides users with a clear and simple overview of the indicators monitored throughout the operation. For example, it enables users to instantly see whether worksite start-up and shutdown times have been respected. It also identifies the time periods during which regulatory thresholds are exceeded.
 - Choice of period displayed: Day, Week, Month, Year
- Choice of time unit, depending on the period displayed: 1 min, 2 mins, 5 mins, 15 mins, 1 hr, 24 hrs
- Choice of indicator: average LAeq, LAMax, LA99, alarm, meteorological data, etc.

- Location of the considered measurement point(s) and associated description
- 01dB HeatMap over the period displaying the indicator selected by the user
- List of alarms during the selected period of time
- Variation of the selected indicators over time
- Table of indicators
- New banner with weather information displayed on the "Site" and "Station" pages in real time
- Time history on the "Station" page in real time and on the "Point" page offline
- Wind speed
- Wind direction
- Air temperature
- Relative humidity
- Rain intensity
- Atmospheric pressure.
01dB WebMonitoring FeaturesInclude:
Simplified implementation and management of monitoring
- No IT structure required
- No management of phone subscription
- Supply of plug & play monitoring terminals
- Simple and user-friendly Web interface (no training required)
- 24/7 information available from any computer or mobile device
Enhanced productivity
- Class-1 reliability of data measured by 01dB terminals
- Fast implementation of Web interface
- Automatic calculation of recomposed indicators and publishing of synthetic results using a colour code (red, orange, green)
- Fast data analysis using the 01dB HeatMap visual tool
- Alarm management from the Web interface
- Automated reports about user-selected periods (day, week, month, year, etc.)
Cost control
- Fixed monthly cost per terminal, all services included
- No hardware investment (monitoring terminal and computer hardware)
- Project cost splitting over the entire monitoring period
- Capacity to address projects requiring several terminals over a short period of time
- Unlimited number of terminals, sites and users
01dB WebMonitoring Applications Include:
The 01dB WebMonitoring service offer applies to all types of monitoring projects. It can be used to measure, monitor and manage noise and vibration in multiple applications:
- construction sites
- urban areas
- places playing music
- industrial sites
- airports and airfields
- heliports
- road infrastructures
- rail infrastructures
- wind farms
- recreational activities...